Using the Fluorolog™-3
Luminescence Spectroscopy .Fluorolog Setup and Operation Instructions
Watch the movie on Fluorimeter Startup and Calibration Click here
pdf version
Theory of Luminescence
Basic Design of an Fluorimeter Spectrometer
Miramar College, S5-210
Horiba Jobin Yvon Fluorolog™-3Features of the Horiba Jobin Yvon FluoroLog™-3
Preparing Instrument for OperationSign the Log book
Turn on Power and Lamp Switch
Flip the Power switch to power up the instrument.
Flip the Lamp switch above the power switch.
WAIT 15 min. before turning on the instrument computers
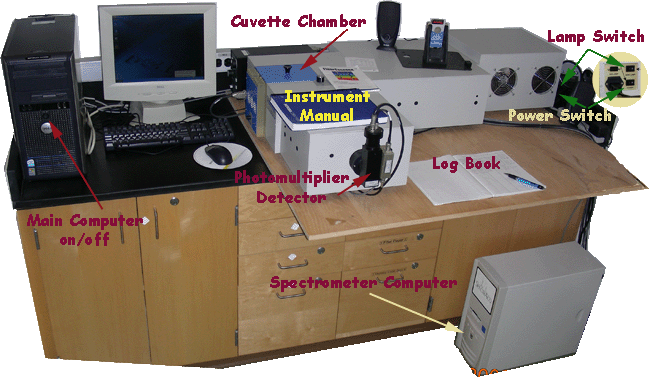
Turn on computer after 15 minutes.
Press the start button on the instrument computer (floor), this operates the fluorimeter.
Turn on the Dell Optiplex GX620 PC computer, that drives the software for the instrument.
MS Windows will start with the display below.
Click on the FluoroEssence Icon to launch the program
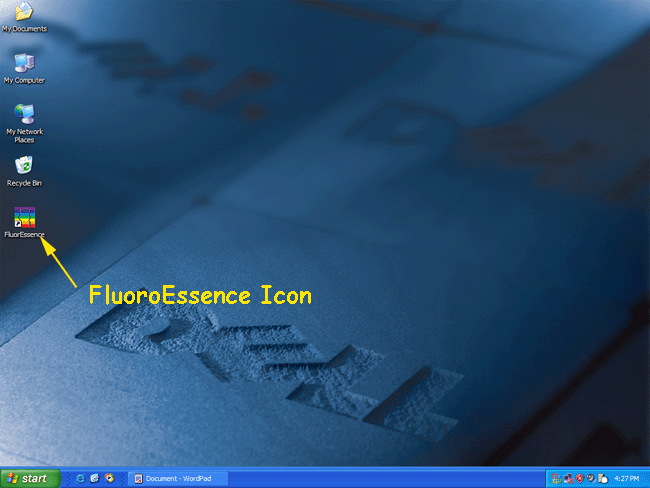
FluoroEssence
Opening Screen of the FluoroEssence Window
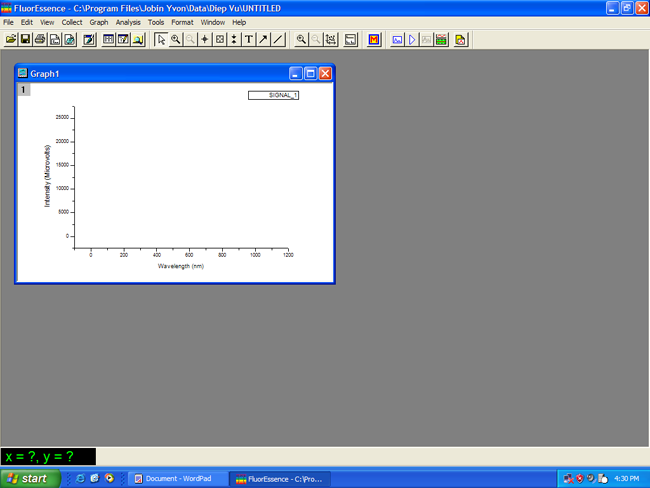
FluoroEssence → Experiment
Click on Experiment Icon on the top toolbar
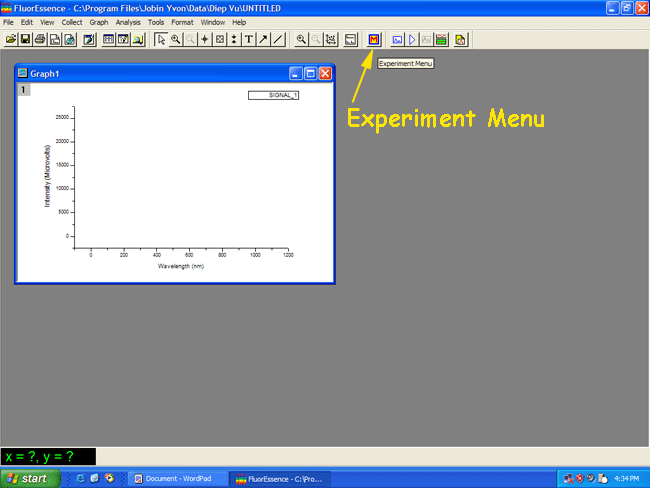
FluoroEssence → Experiment
The instrument will initialize the setting
The wavelength motor will adjust the wavelength setting to the appropriate positionAt this point a high pitch can be heard (if not, repeat this procedure)
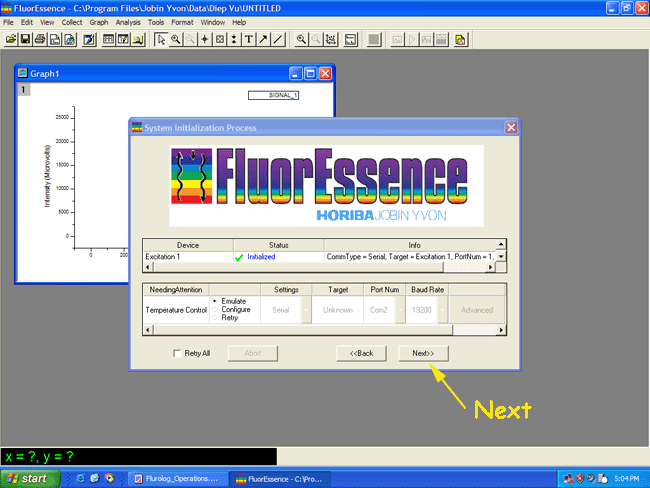
FluoroEssence → Experiment → Spectra (Excitation)
Select the Spectra selection
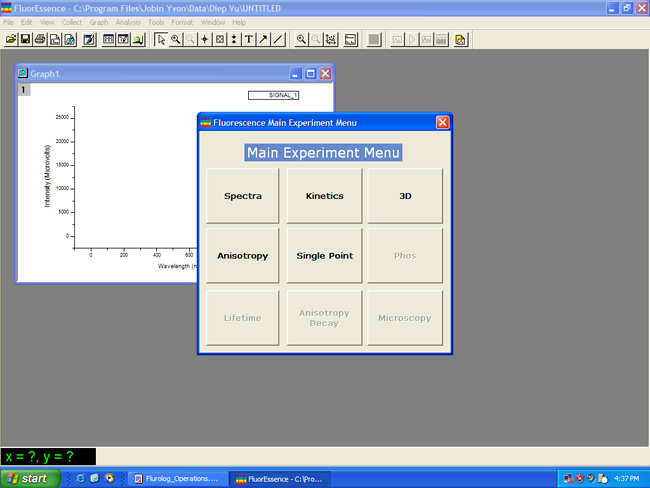
FluoroEssence → Experiment → Spectra (Excitation)
Choose Excitation on the next screen
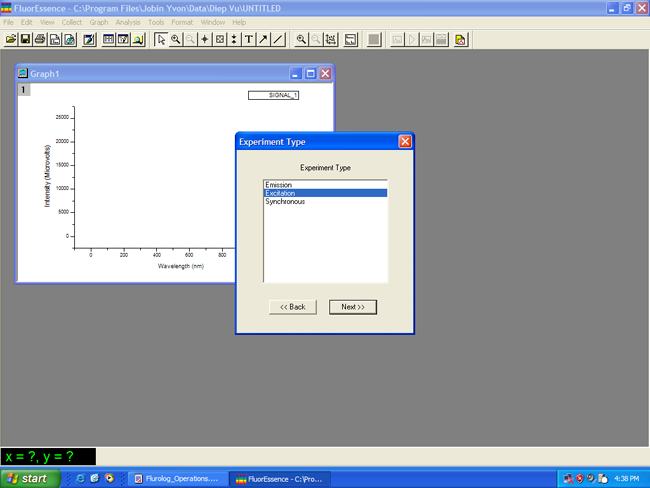
FluoroEssence → Experiment → Spectra (Excitation)
Check for the following parameter or adjust to-
(bandpass)
1200 groove/nm
Wavelength
WavelengthDefault detector parameters for xenon-lamp scan Detector (Signal) Integration Units Signal (SI) 100 ms CPS Reference (RI) 100 ms mA Click on Run.
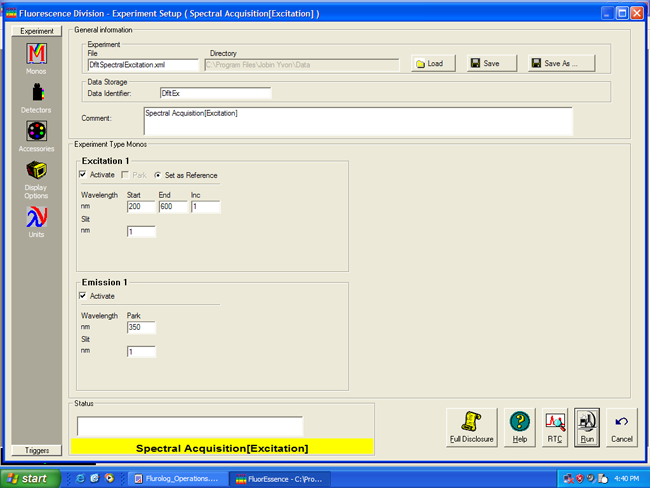
FluoroEssence → Experiment → Spectra (Excitation)
The Fluorolog Instrument will begin running the excitation scan on the xenon lamp
FluoroEssence → Experiment → Spectra (Excitation)
After the excitation scan is complete
the computer will prompt for the a file name.
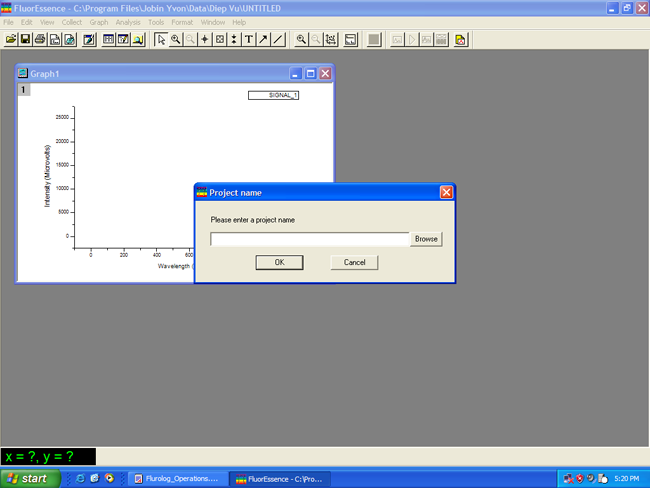
FluoroEssence → Experiment → Spectra (Excitation)
After entering the filename, the screen will display
the uncalibrated FluoroMax Lamp Spectrum.The highest peak should be centered at 467 nm.
Use the data reader (from the toolbar) to inspect the position of the signal.
Grab the left portion of the spectra to enlarge the spectrum window.
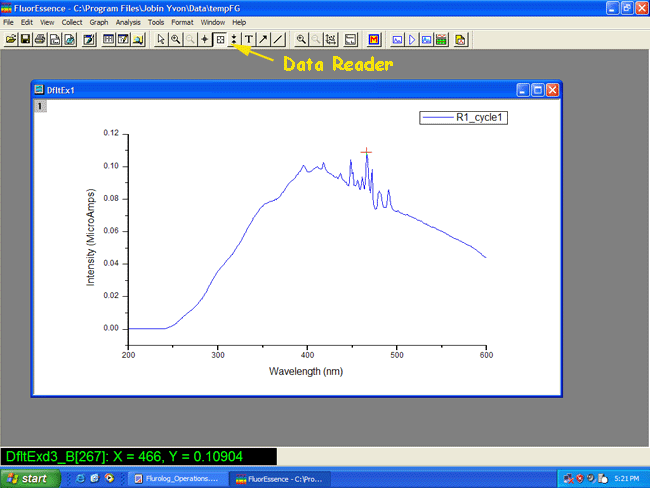
FluoroEssence → Experiment → Spectra (Excitation)If the most intense peak is 467 + 1 nm, then the instrument is calibrated for excitation.
You may proceed to calibrate the emission parameters.If the signal is not centered at 467 nm, that is the signal is off by more than 4 nm,
then steps must be taken to calibrate the excitation monochromator.
Go to the instrument operation manual for this procedure.
FluoroEssence
Prepare a water sample using ultra high purity water.
Insert the cuvette containing the water into the cuvette compartment
Close the lid and select the FluoroEssence Key in the toolbar.
FluoroEssence → Experiment
Select the Experiment Menu to begin Emission Calibration.
FluoroEssence → Experiment → Spectra (Emission)
Choose Spectra
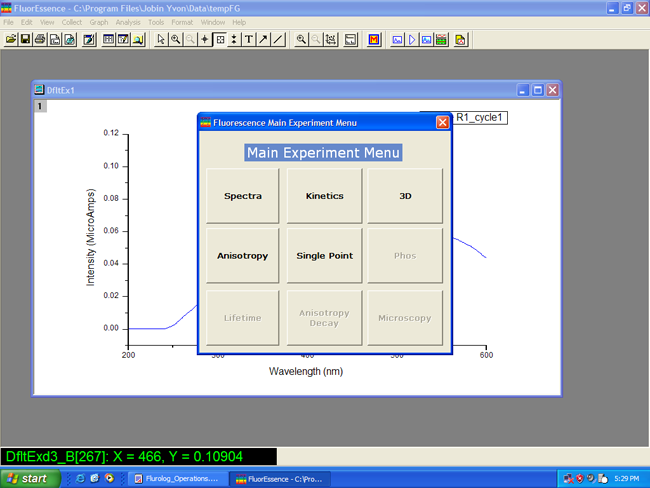
FluoroEssence → Experiment → Spectra (Emission)
Select Emission and then Next
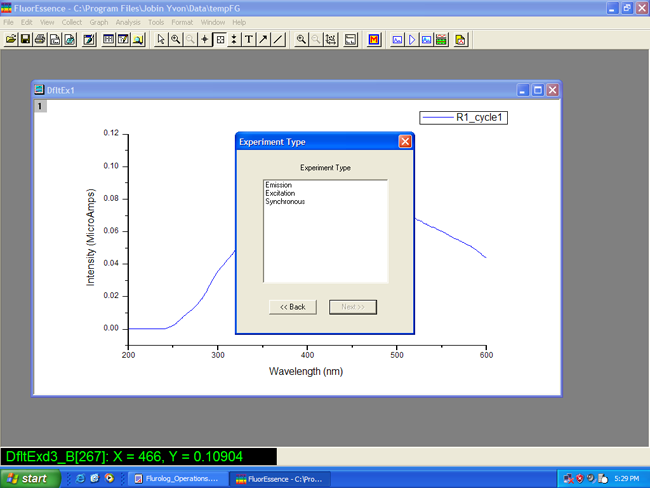
FluoroEssence → Experiment → Spectra (Emission)
Choose the default parameter for the water-Raman scan:
Check for the following parameter or adjust to-
(bandpass)
1200 groove/nm
Wavelength
WavelengthDefault detector parameters for xenon-lamp scan Detector (Signal) Integration Units Signal (SI) 100 ms CPS Reference (RI) 100 ms mA Click on Run.
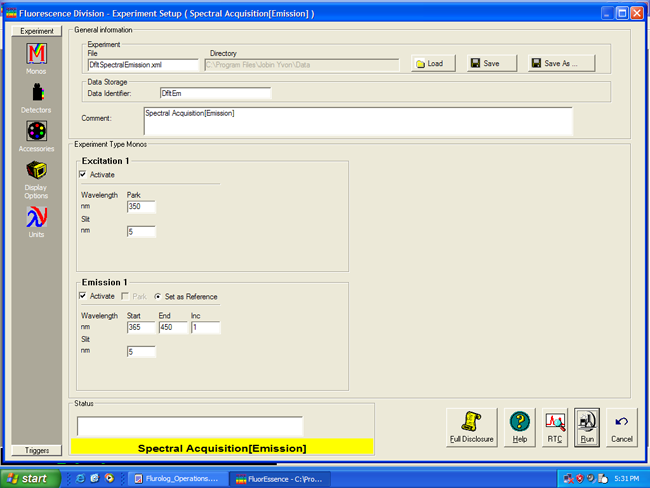
FluoroEssence → Experiment → Spectra (Emission)
The spectrometer will run an emission scan for water and a broad signal centered at 397 nm.
.
FluoroEssence → Experiment → Spectra (Emission)
After the scan, the screen will show the water-Raman spectra. Use the data reader to confirm that the signal is centered at 397 nm.
If the water-Raman peak is not centered at 397 + 1 nm, calibrate the emission monochomator. Refer to the instrument operation manual for this procedure.
.
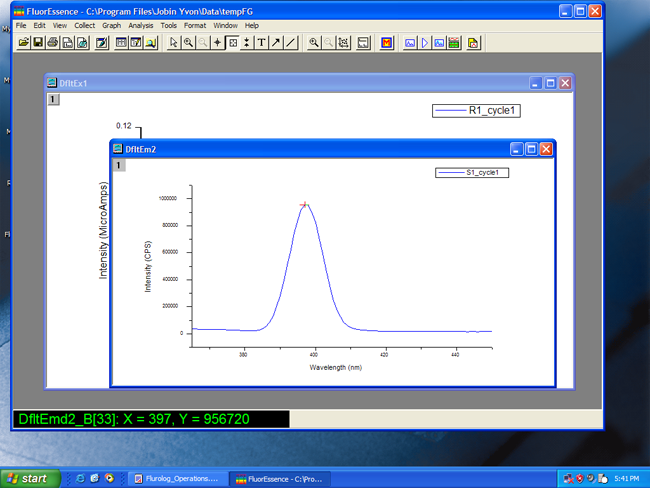
FluoroEssence → Experiment → Spectra (Emission)
Report the intensity of the water-Raman line in the log book.
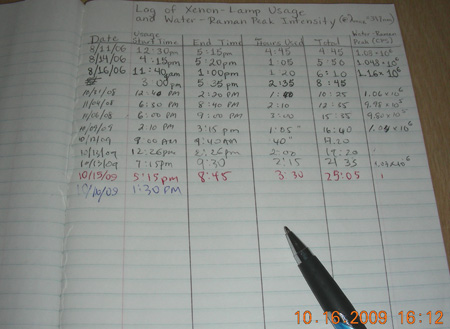
As long as the instrument is not turn off, calibration need not be performed again until the lamp is turned off.
If everything checks, you are ready to use the instrument for the experiment. Refer to the directions of the experimental procedure to determine the settings of the instrument.
Startup, Warmup and Calibration
.