5
Cyclic Voltammetry of Sample Solution
 1. Double-click on the Potentiostat button again and switch the current range to 10 ?A on the potentiostat dialog box. Click on OK to close the Potentiostat dialog box.
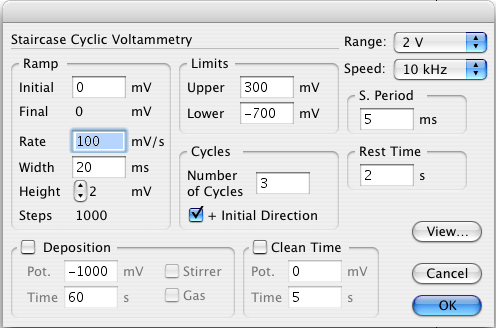
2. From the techniques menu select Cyclic Voltammetry. This opens the Staircase Cyclic Voltammetry dialog box, which is used to set the limits and ramp rate of the voltage waveform applied to the working electrode.
 In the dialog box, select the following parameters:
Initial = 0 mV
Final = 0 mV
Upper Limit = 700 mV
Lower Limit = -700 mV
Rest Time = 5 s
Ramp Rate = 100 mV/s
Step Width = 20 ms
Step Height = 2 mV
Sampling Period = 5 ms
Number of Cycles = 3
(These parameters are for Ferrocene Carboxylic Acid. The parameters can be changed for the particular sample that will be analyzed. Glossary for parameters is located at the end of the procedure.)
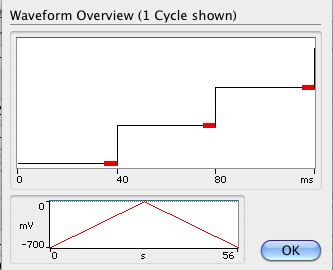
Click on View to preview the waveform defined.
3. Select the Notebook under the Windows menu. Write some general notes on the experiment including your name, Date, time and solution details. Close the window and save the file using a suitable filename.
 4. Lift the nitrogen line out of the solution. Check that there are no bubbles trapped on the surface of the electrode. If there are, lightly tap the cell to dislodge them.
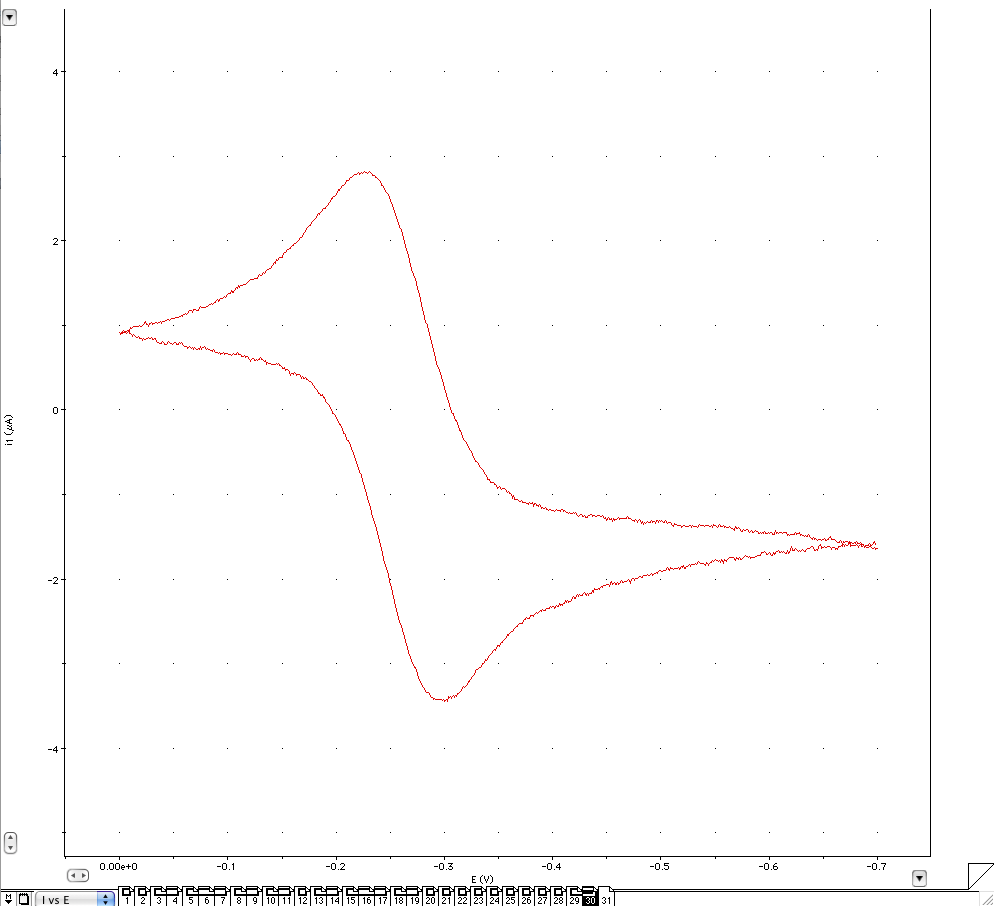
5. Click on Start to begin the potential scans. After the scans, place the nitrogen line back into the solution. The scan should look like the voltammogram below.
6. Adjust the current range under the potentiostat menu and apply the low pass filter if the signal is too noisy. Change the settings in the staircase Cyclic Voltammetry dialog box by adjusting the upper and lower limit so that the scan is zoomed to the oxidation reduction potential (0 to -700mV). If the current reading goes off scale, adjust the current range, and repeat the scans. If the signal has too much noise, adjust the Low Pass filter to a lower number. Adjust the other parameters after the scan is run to optimize the signal. Note the changes of the voltammogram at different settings. Example: the lower the ramp rate is, the longer it takes to make a graph but the more accurate the graph will be. Rate is related to step height and width by Rate = Step Height * Step Width. After the scans are done, click on the Page comment button (bottom left of screen) and enter a comment for the middle scan (solution, scan rate etc.). The arrows on the horizontal and vertical axis make the graph wider or slimmer.
7. Degas the solution again with nitrogen remember that the solution should be degassed after each trial. In the Staircase Cyclic Voltammetry dialog box, change the following parameters- • Ramp Rate to 200 mV/s, • Step Width to 10 ms • Sampling Period to 2.5 ms. Repeat Steps 4 to 6 to obtain a new set of three voltammograms.
 8. Repeat Step 7, with the following parameters-
•Ramp Rate of 500 mV/s •Step Width of 4 ms •Sampling Period of 1 ms, adjusting the current range if necessary. Next repeat Step 7 again, with the following parameters-
•Ramp Rate of 1000 mV/s •Adjust the other parameters accordingly to optimize the voltammogram.
9. Switch the current range to an optimum value and obtain scans at Ramp Rate of 10 mV/s, Step Width of 200 ms, Sampling Period of 50 ms, and Current Range to 50 uA.